# 水平面积 measure.area 在模型上测量的时候会被模型遮挡
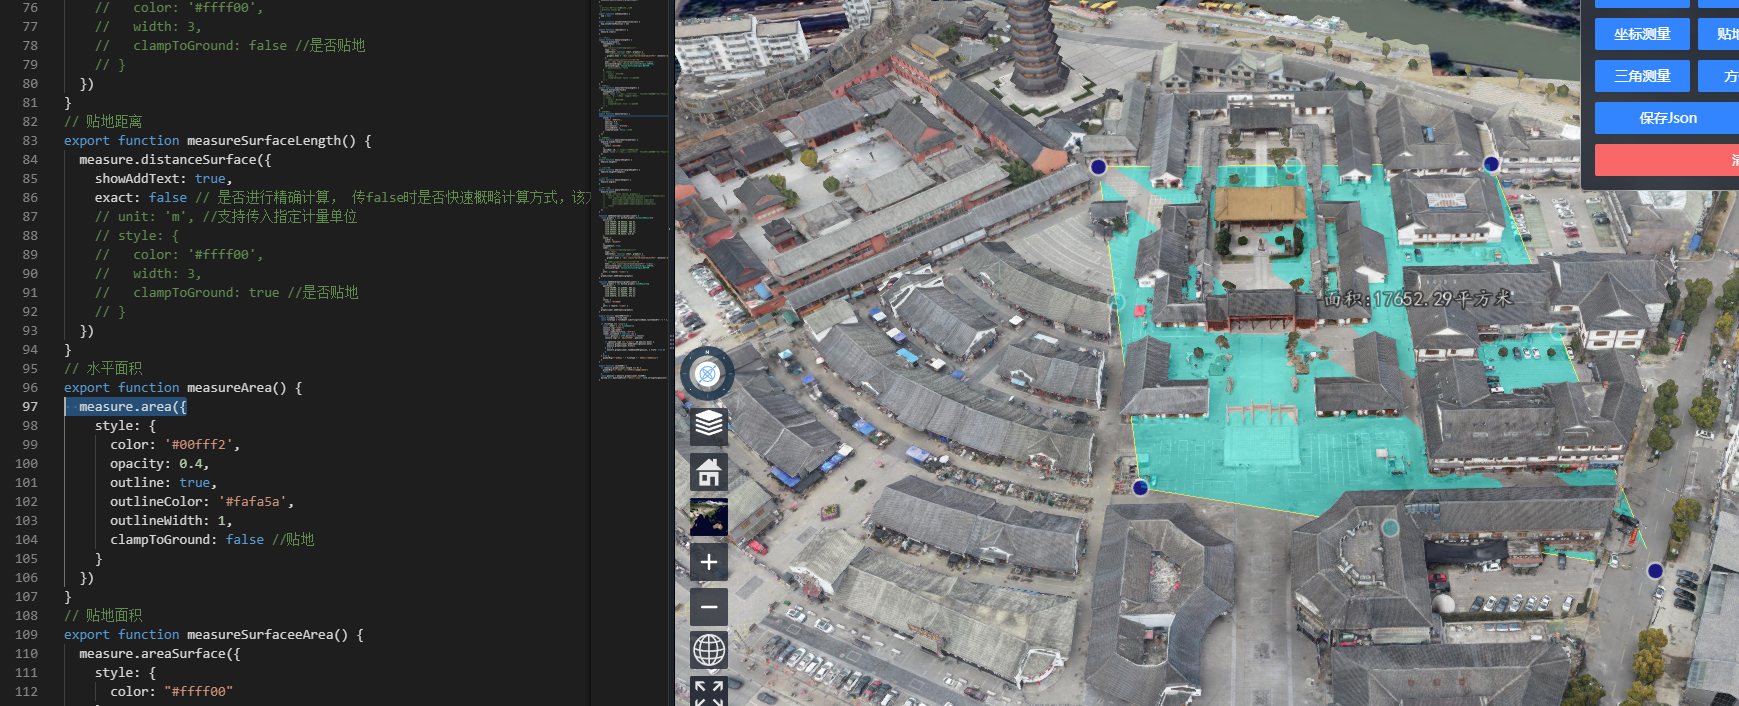
期望通过 addHeight:10000,增加高度也不可以实现这种被遮挡的效果,都增加到 10000 了,还是会被遮挡
export function measureArea() {
  measure.area({
    style: {
      color: "#00fff2",
      opacity: 0.4,
      outline: true,
      outlineColor: "#fafa5a",
      outlineWidth: 1,
      addHeight: 10000,
      clampToGround: false, //贴地
    },
  });
}
1
2
3
4
5
6
7
8
9
10
11
12
13
2
3
4
5
6
7
8
9
10
11
12
13
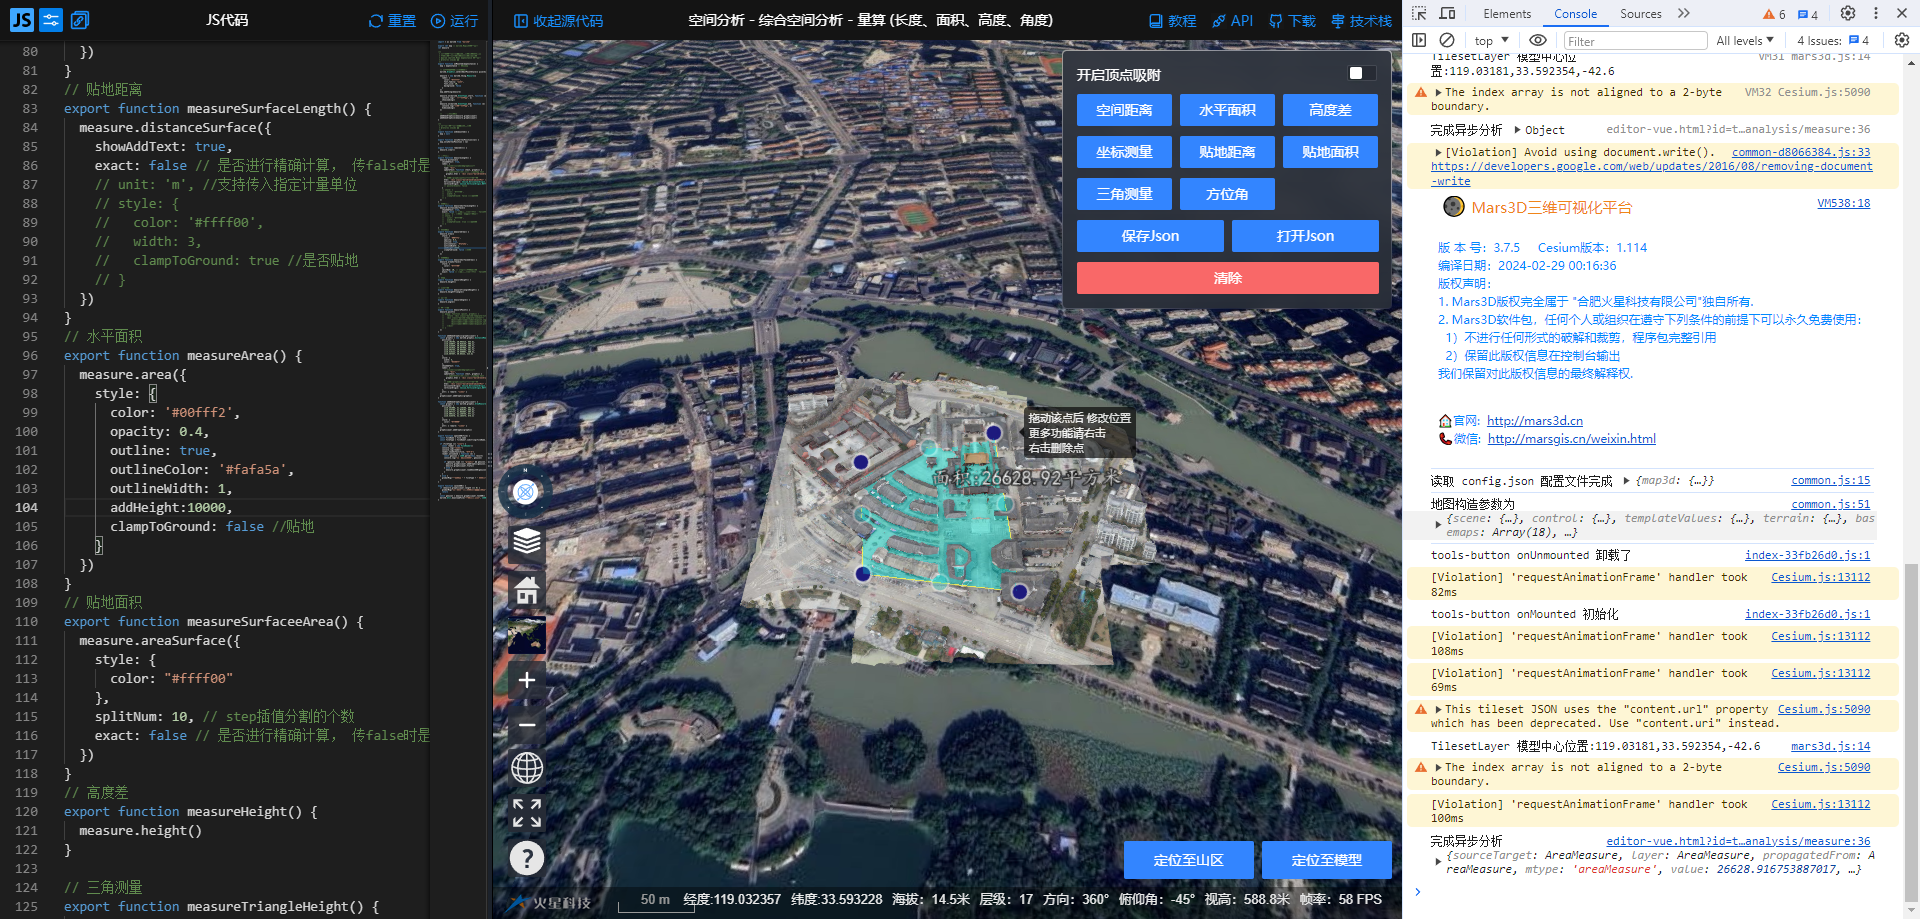
添加 visibleDepth:false 不生效,可以加 clampToGround: true ,只是贴地效果,不影响结果值。
export function measureArea() {
  measure.area({
    style: {
      color: "#00fff2",
      opacity: 0.4,
      outline: true,
      outlineColor: "#fafa5a",
      outlineWidth: 1,
      clampToGround: true, //贴地
    },
  });
}
1
2
3
4
5
6
7
8
9
10
11
12
2
3
4
5
6
7
8
9
10
11
12
addHeight 只能构造后有用,所以加个效果也可以的。但是如果测量的是斜面,虽然数值不会错,但是视觉效果看起来就跟贴模型面积一样,容易产生误解。
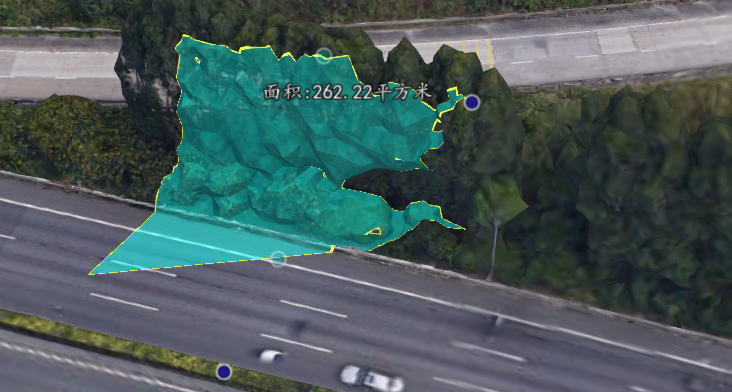
此时的解决方案:
measure
  .area({
    // style: {
    //   color: '#00fff2',
    //   opacity: 0.4,
    //   outline: true,
    //   outlineColor: '#fafa5a',
    //   outlineWidth: 1,
    //   clampToGround: false //贴地
    // }
  })
  .then(async (graphic) => {
    const oldPositions = graphic.positionsShow;
    const rang = await mars3d.PolyUtil.getHeightRangeByDepth(
      oldPositions,
      map.scene
    );
    graphic.positions = mars3d.PointUtil.setPositionsHeight(
      oldPositions,
      rang.maxHeight
    );
  });
1
2
3
4
5
6
7
8
9
10
11
12
13
14
15
16
17
18
19
20
21
22
2
3
4
5
6
7
8
9
10
11
12
13
14
15
16
17
18
19
20
21
22
# measure.point()坐标量算的结果支持自定义展示
比如说想把弹窗里面的高程数据加 10,但是在示例中的 popup 测量结果中不知道如何自定义展示。

解决方案:3.6.16 版本增加了 popup 参数支持自定义展示
// 坐标测量
export function measurePoint() {
  measure.point().then((graphic) => {
    graphic
      .bindPopup(
        (event) => {
          const point = graphic.point;
          point.format();

          return `<div class="mars3d-template-title">${map.getLangText(
            "_位置信息"
          )}</div>
                <div class="mars3d-template-content">
                    <div><label>${map.getLangText("_经度")}</label>${
            point.lng
          }</div>
                    <div><label>${map.getLangText("_纬度")}</label>${
            point.lat
          }</div>
                    <div><label>${map.getLangText("_海拔")}</label>${
            point.alt
          }${map.getLangText("_米")}</div>
                </div>`;
        },
        {
          autoClose: graphic.style.autoClose ?? false,
          closeOnClick: graphic.style.closeOnClick ?? false,
        }
      )
      .openPopup();
  });
}
1
2
3
4
5
6
7
8
9
10
11
12
13
14
15
16
17
18
19
20
21
22
23
24
25
26
27
28
29
30
31
32
2
3
4
5
6
7
8
9
10
11
12
13
14
15
16
17
18
19
20
21
22
23
24
25
26
27
28
29
30
31
32
# AreaSurfaceMeasure 可以支持修改测量结果交互方式
比如我想把右键改成结束测量。现在是双击,可以增加支持
//内置GraphicLayer的参数均支持,同GraphicLayer

measure = new mars3d.thing.Measure({
  drawEndEventType: mars3d.EventType.rightClick,
  drawDelEventType: mars3d.EventType.middleClick,
});
map.addThing(measure);
1
2
3
4
5
6
7
2
3
4
5
6
7
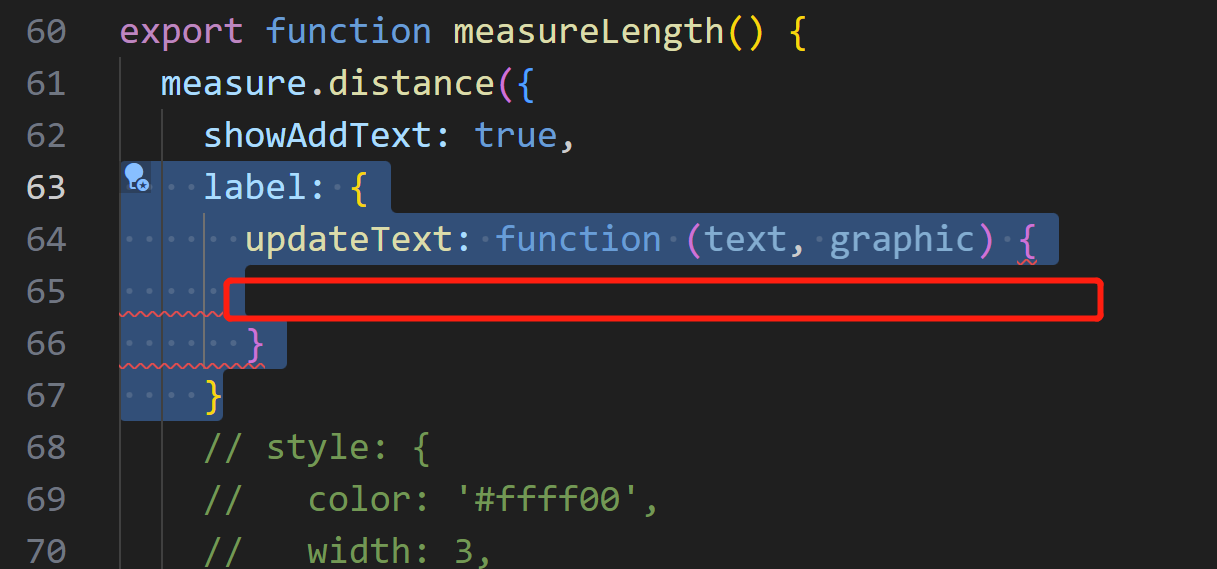
# 控制测量结果的 label 显示偏移效果时,【起点】文本如何自定义判断
修改测量结果的偏移值之后,起点文本也会偏移,能控制吗?
现在不是控制测量结果,是控制起点文本, 结果文本 label 和【起点】会一起偏移。
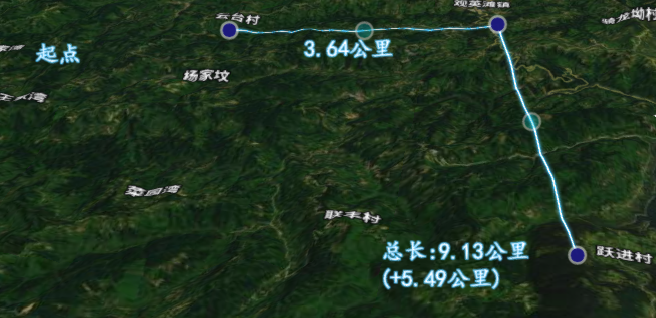
下个版本中增加一个回调方法参数,可以内部做判断进行一些个性化处理。
# measure-section 剖面分析能否支持直接调用?
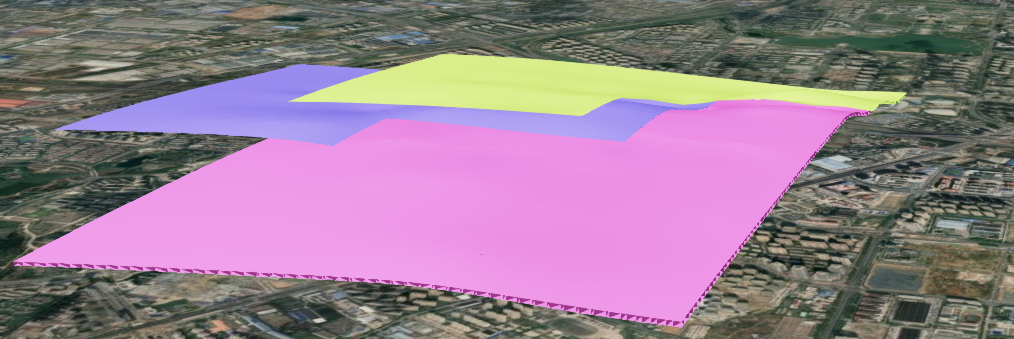
- 现在有三个地质体模型,想用剖面分析画一条线,得到三个面的剖面分析。
- 三个面的剖面分析,虽然是同一条线,但是需要针对三个模型 new 三次分析,才能得到三次分析结果
- 传入的线的数据是一样的,但是需要针对三个模型调用三次分析
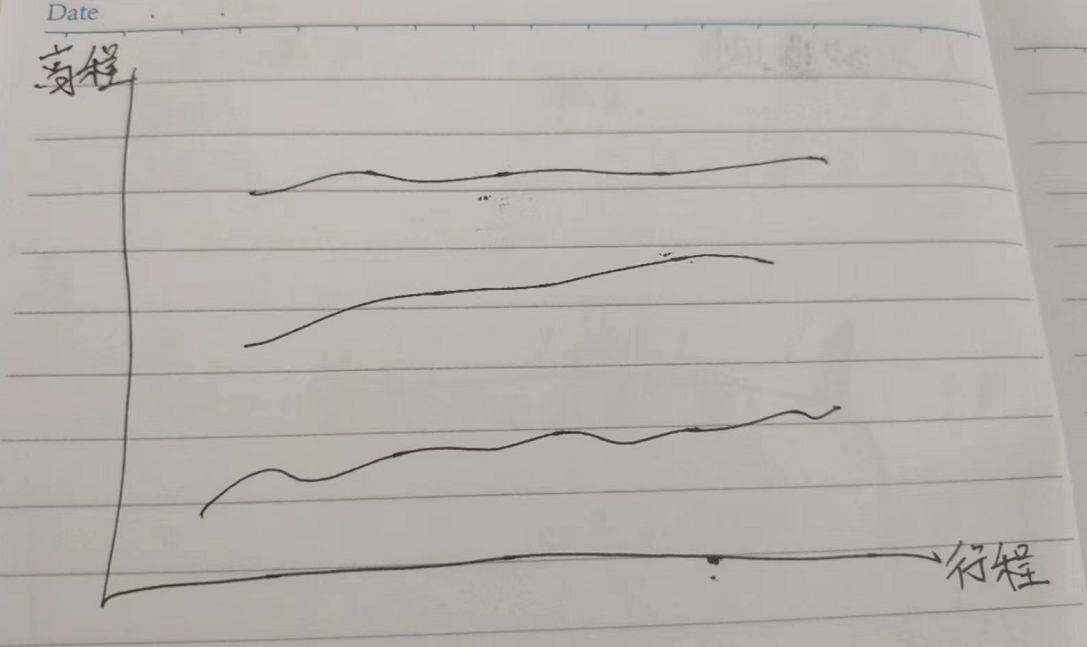
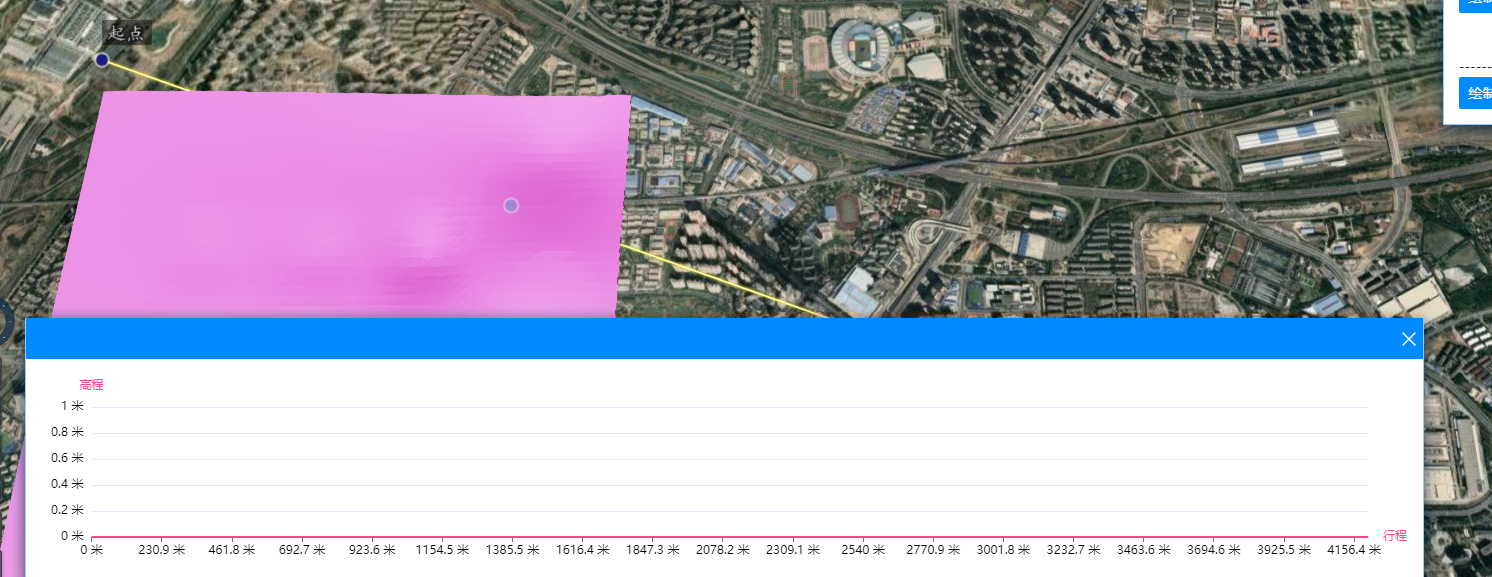
解决方案:
- 按 3 次进行分析,
- 第一次分析结束回调后,隐藏最顶部的对象,
- 第二次分析结束后影藏第 2 个顶部对象,
- 全部分析完成后改回显示。
- 第二次分析 要怎么执行的话,就简单点就 3 个 SectionMeasure 实现。
# AreaMeasure 拿到的 graphic.area 平方米换算成平方千米结果不一致的说明
- thing/analysis/measure 示例的 AreaMeasure 拿到的 graphic.area 平方米换算成平方千米之后,为什么不一样
- 拿到的 graphic.area 的数值是 168783261.1153345,换算成平方千米之后,168783261.1153345 平方米=168.783261115 平方千米(平方公里)
- 示例中量算结果是 168.33 平方公里,是为什么呢?
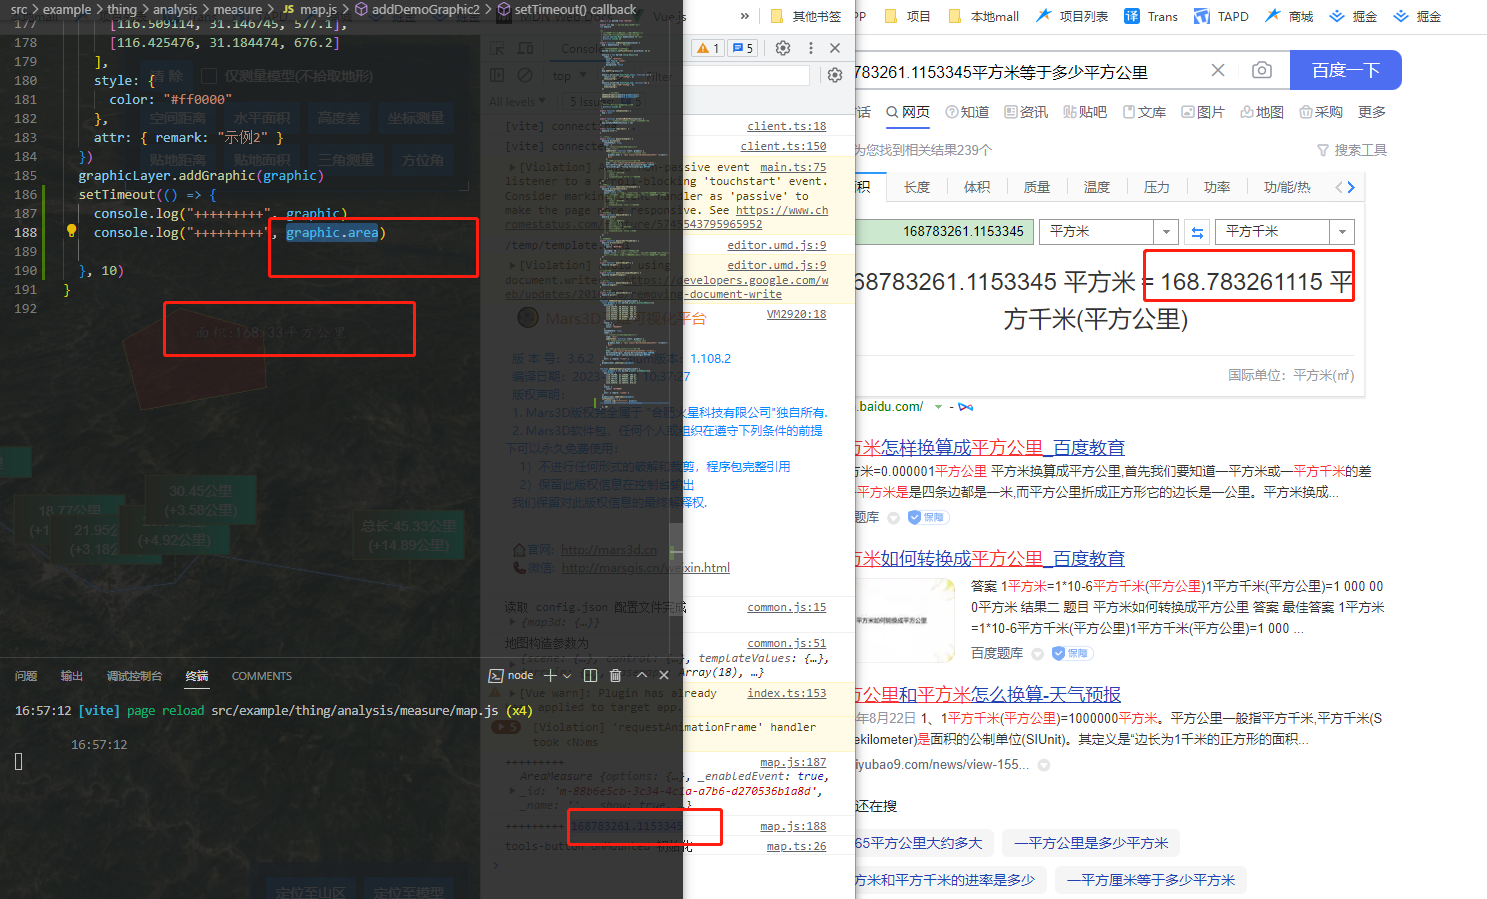
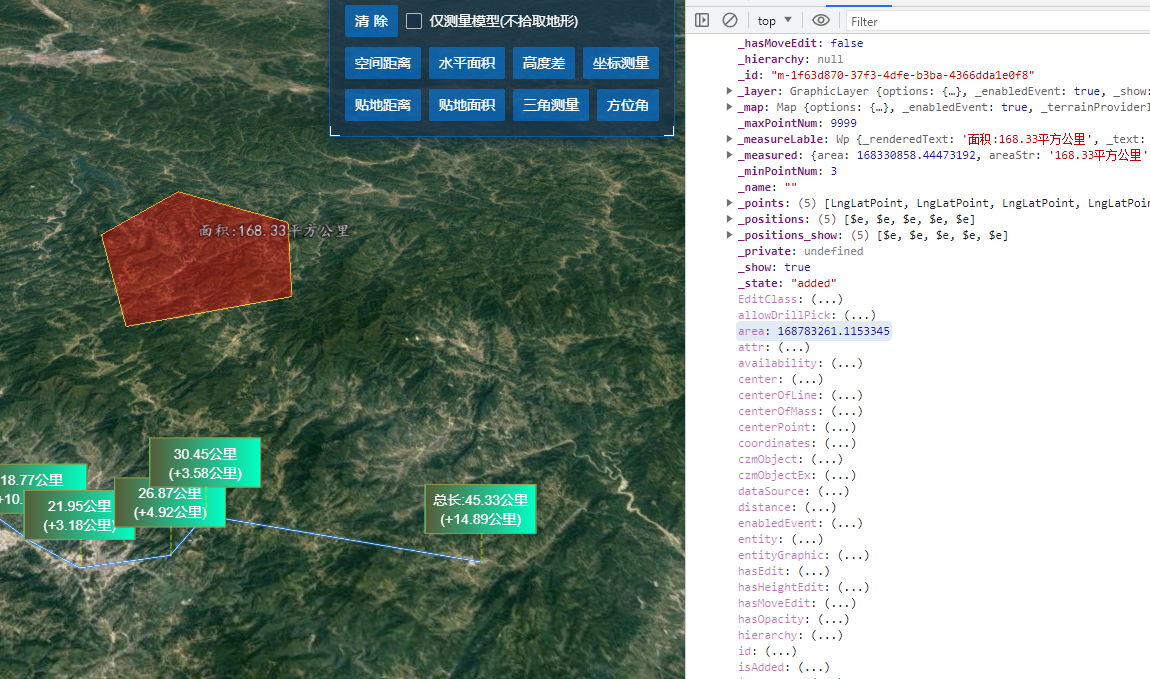
现象说明:后续版本我们统一下,准确的计算结果可以 mars3d.MeasureUtil.下有多个计算方法,按需选用
mars3d.MeasureUtil.getArea();
mars3d.MeasureUtil.getSurfaceArea();
mars3d.MeasureUtil.getClampArea();
1
2
3
2
3
# HeightTriangleMeasure 三角测量的编辑过程中测量结果,可以自定义展示说明
- HeightTriangleMeasure 三角测量的编辑过程中测量结果,可以自定义展示吗?
- 比如不希望在编辑过程中,展示空间距离,会和水平距离有文字堆叠的情况。
- measure.heightTriangle 三角高度测量编辑完毕的样式可以通过 Promise.then 去修改
- 请教一下编辑中的样式怎么修改需要屏蔽空间距离的显示 仅显示高度差和水平距离。
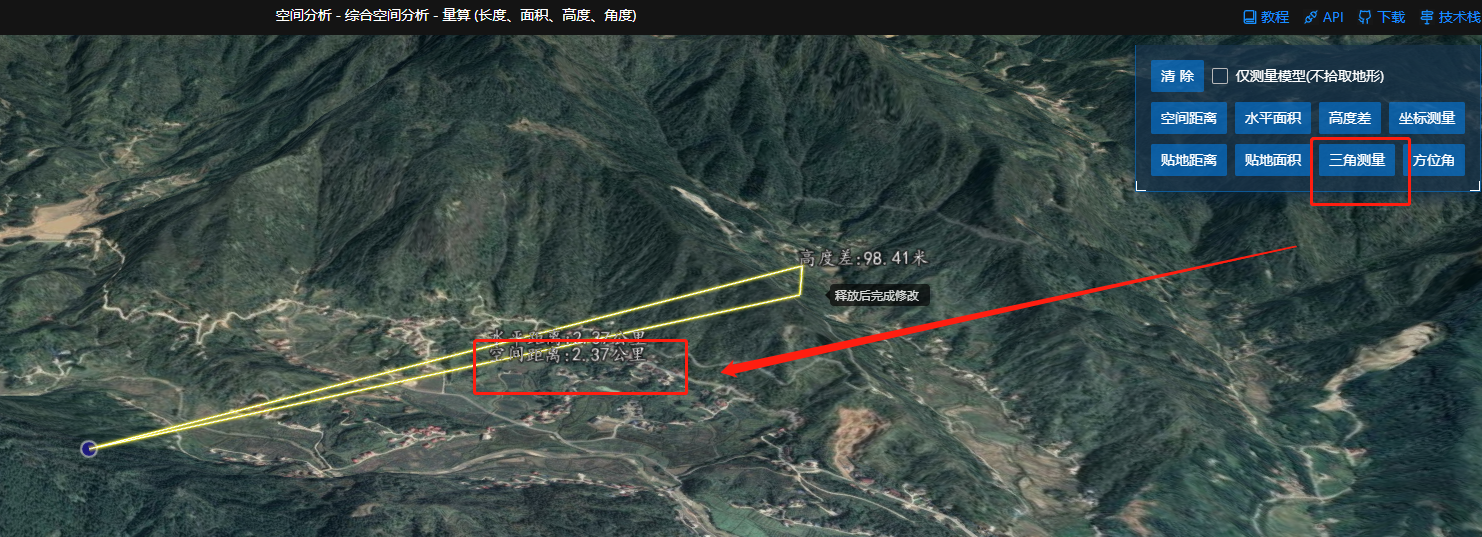
measure.on(mars3d.EventType.change, function (e) {
  e.graphic._measureDistanceLable.show = false;
});

measure.heightTriangle({}).then((res) => {
  res._measureDistanceLable.show = false;
  measure.off(mars3d.EventType.change);
});
1
2
3
4
5
6
7
8
2
3
4
5
6
7
8
# 使用 setCallbackPositions()方法改变坐标位置信息就无法显示出距离信息说明
解决方案:
- 手动调用下 graphic._updatePositionsHook()
graphic.setCallbackPositions([
  [116.650389, 31.157506, 550.4],
  [116.506067, 30.977433, 516],
  [116.624283, 30.878335, 253.9],
  [116.710622, 31.005702, 667.9],
]);
graphic._updatePositionsHook();
1
2
3
4
5
6
7
2
3
4
5
6
7
- 需要按下面格式写
let graphic = graphicRouteLine.getGraphicById("929353413");

graphic.setCallbackPositions(newPositions); //传下坐标即可
graphic._updatePositionsHook();
1
2
3
4
2
3
4
# 等值面的颜色能设置成渐变色吗
渐变色不可以呢 , 每一个色带实际是一个面
