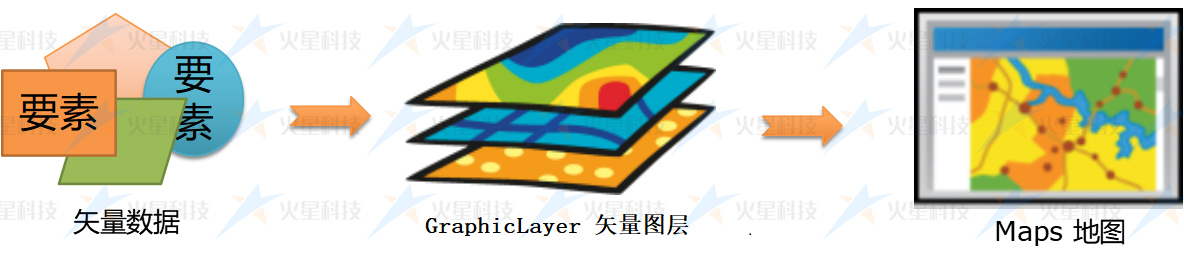
三维场景中,地形和栅格来组成了三维的基础,但更多的业务还是需要 点线面等矢量数据来充实, 这就是我们的矢量数据图层。
# 1. 图层类型清单
当前主要使用的矢量图层,是指GraphicLayer (opens new window)类及其子类对象。 矢量图层中可以通过addGraphic方法来加入各类型 (opens new window)的矢量数据 (opens new window)来组成。
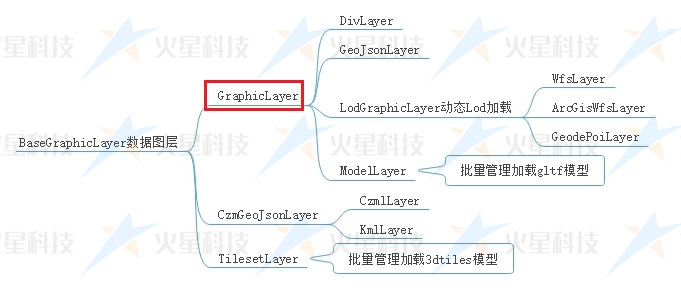
目前常用的矢量图层有以下类型:
| 类型名 | 功能 | 类名 | 功能示例 |
|---|---|---|---|
| graphic | 矢量图层 | mars3d.layer.GraphicLayer (opens new window) | 查看 (opens new window) |
| busineData | 业务数据图层 | mars3d.layer.BusineDataLayer (opens new window) | 查看 (opens new window) |
| wfs | WFS标准服务图层 | mars3d.layer.WfsLayer (opens new window) | 查看 (opens new window) |
| arcgis_wfs | ArcGIS Feature Server服务图层 | mars3d.layer.ArcGisWfsLayer (opens new window) | 查看 (opens new window) |
| geojson | GeoJson文件图层 | mars3d.layer.GeoJsonLayer (opens new window) | 查看 (opens new window) |
| czml | CZML文件图层 | mars3d.layer.CzmlLayer (opens new window) | 查看 (opens new window) |
| geojson_shp | Shapefile(SHP)文件图层 | Shp2JsonLayer.js (opens new window) 独立插件JS | 查看 (opens new window) |
| geojson_kml | KML文件图层 | Kml2JsonLayer.js (opens new window) 独立插件JS | 查看 (opens new window) |
| tileset | 3DTiles三维模型图层 | mars3d.layer.TilesetLayer (opens new window) | 查看 (opens new window) |
| i3s | I3S三维模型图层 | mars3d.layer.I3SLayer (opens new window) | 查看 (opens new window) |
# 2. 矢量图层的创建及使用
# 2.1 快速开始(初始化 new Map 时传入)
在构造Map时传入layers参数中配置相关图层,并设置show:true后进行初始化加载矢量图层
var map = new mars3d.Map('mars3dContainer', {
 layers: [
   {
     "id":1987,
     "type": "geojson",
     "name": "示例数据",
     "url": "http://data.mars3d.cn/file/geojson/geojson-draw.json",
     "popup": "{name}",
     "show": false
   }
 ]
})
//可以通过下面方法获取到配置的图层
let tiles3dLayer = map.getLayer(1987,'id')
2
3
4
5
6
7
8
9
10
11
12
13
14
# 2.2 代码中创建图层
可以有下面2种方式来创建图层对象:
//用工厂方法,指定type来创建图层对象
var wfsLayer = mars3d.LayerUtil.create({
 name: '合肥教育点',
 type: 'wfs',
 url: 'http://server.mars3d.cn/geoserver/mars/wfs',
 layer: 'mars:hfjy',
 parameters: {
   maxFeatures: 500,
 },
 minimumLevel: 13,
 symbol: {
   type: 'billboardP',
   styleOptions: {
     image: 'img/marker/mark1.jpg',
     verticalOrigin: Cesium.VerticalOrigin.BOTTOM,
     clampToGround: true,
   },
 },
 popup: 'all',
 show: true,
})
map.addLayer(wfsLayer)

//直接创建具体类型的图层对象
var geoJsonLayer = new mars3d.layer.GeoJsonLayer({
 name: '标绘示例数据',
 url: 'http://data.mars3d.cn/file/geojson/geojson-draw.json',
 popup: '{type} {name}',
 flyTo: true,
})
map.addLayer(geoJsonLayer)
2
3
4
5
6
7
8
9
10
11
12
13
14
15
16
17
18
19
20
21
22
23
24
25
26
27
28
29
30
31
在Map创建后可以通过map.addLayer (opens new window)和map.removeLayer (opens new window)方法来控制图层的加载和删除。
在图层本身也有 layer.addTo (opens new window)和layer.remove (opens new window)2个方法支持添加或移除图层。
# 3 常用矢量图层类
# 3.1 GraphicLayer
矢量数据图层
//创建矢量数据图层
let graphicLayer = new mars3d.layer.GraphicLayer()
map.addLayer(graphicLayer)

//加载数据到矢量图层
let graphic = new mars3d.graphic.LabelEntity({
  position: new mars3d.LngLatPoint(116.1, 31.0, 1000),
  style: {
    text: 'Mars3D三维可视化平台',
    font_size: 25,
    color: '#003da6',
  },
})
graphicLayer.addGraphic(graphic)
2
3
4
5
6
7
8
9
10
11
12
13
14
运行效果
# 3.2 GeoJsonLayer
GeoJSON是适合于Web下对各种地理数据结构进行编码的格式,基于Javascript对象表示法的地理空间信息数据交换格式。与普通json文件格式区别在于对其属性及组成由一定规范。
GeoJSON将所有的地理要素分为Point、MultiPoint、LineString、MultiLineString、Polygon、MultiPolygon、GeometryCollection。首先是将这些要素封装到单个的geometry里,然后作为一个个的Feature(要素);要素放到一个要素集合里构成。
GeoJSON是平台很重要的数据格式,当前平台内矢量数据均支持导出GeoJSON和导入GeoJSON格式。
let geoJsonLayer = new mars3d.layer.GeoJsonLayer({
  name: '省界线',
  url: 'http://data.mars3d.cn/file/geojson/sheng-line.json',
  symbol: {//可以通过配置symbol参数来指定渲染的矢量数据类型和样式。
    type:"polyline",
    styleOptions: {
      color: '#ffffff',
      opacity: 0.8,
      width: 2
    },
  },
})
map.addLayer(geoJsonLayer)
2
3
4
5
6
7
8
9
10
11
12
13
常用geojson相关网站:
- 在线生成 GeoJSON:http://geojson.io/ (opens new window)
- SHP转GeoJSON:https://mapshaper.org/ (opens new window)
- 中国行政区划GeoJSON下载:http://datav.aliyun.com/tools/atlas/ (opens new window)
# 3.1 WFS 图层
平台支持 通过WfsLayer类 (opens new window)来加载OGC WFS(如GeoServer)服务 、通过ArcGisWfsLayer类 (opens new window) 来加载ArcGIS Server 服务发布的矢量数据的加载。
//OGC WFS
var wfsLayer = new mars3d.layer.WfsLayer({
    name: '合肥教育点',
    url: 'http://server.mars3d.cn/geoserver/mars/wfs',
    layer: 'mars:hfjy',
    parameters: {
      maxFeatures: 500, //支持所有wfs的参数
    },
    minimumLevel: 13,
    debuggerTileInfo: false,
    symbol: {//可以通过配置symbol参数来指定渲染的矢量数据类型和样式。
      type: 'billboardP',
      styleOptions: {
        image: 'img/marker/mark1.jpg',
        verticalOrigin: Cesium.VerticalOrigin.BOTTOM,
        clampToGround: true,
      },
    },
    popup: 'all',
})
map.addLayer(wfsLayer)


//ArcGIS WFS
var wfsLayer = new mars3d.layer.ArcGisWfsLayer({
  name: '兴趣点',
  url: 'http://server.mars3d.cn/arcgis/rest/services/mars/hefei/MapServer/1',
  minimumLevel: 16,
    symbol: {//可以通过配置symbol参数来指定渲染的矢量数据类型和样式。
    type: 'billboardP',
    styleOptions: {
      image: 'img/marker/mark3.jpg',
      verticalOrigin: Cesium.VerticalOrigin.BOTTOM,
      clampToGround: true,
    },
  },
  popup: '名称:{NAME}<br />地址:{address}',
  show: true,
})
map.addLayer(wfsLayer)
2
3
4
5
6
7
8
9
10
11
12
13
14
15
16
17
18
19
20
21
22
23
24
25
26
27
28
29
30
31
32
33
34
35
36
37
38
39
40
可以通过配置symbol参数来指定渲染的矢量数据类型和样式。
# 2.4 graphicGroup 矢量图层组
目前平台提供了type:'graphicGroup'的GraphicGroupLayer类 (opens new window)类型图层,可以用于图上标绘 的 多图层标绘控制及管理,具体参考 通用项目模版的 图上标绘 (opens new window)功能。